First, what the connector actually gives your AI
DashThis handles the data. AI handles the thinking.
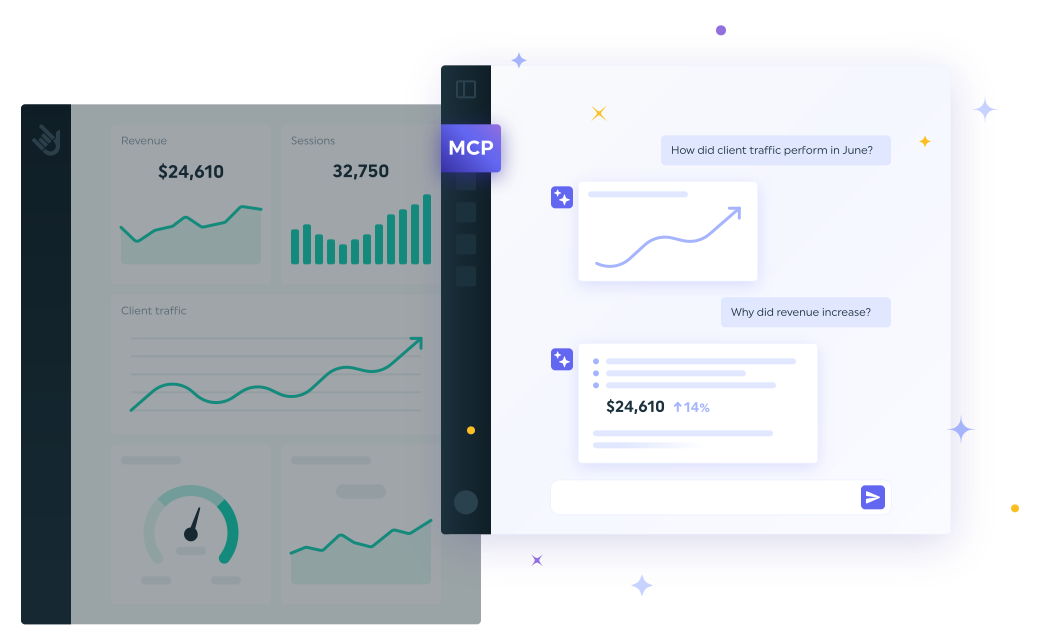
DashThis already does the rigorous part, every month, for every client. It connects to your platforms and handles the authentication. It normalizes what comes back, so a "conversion" means the same thing in August that it meant in March. It applies your calculations. It groups everything by client. And it absorbs the constant churn underneath: endpoints that change, tokens that expire, metrics that get renamed or retired, rate limits, retries. The connector points your assistant at the layer sitting on top of all that.
The same numbers your clients see. When your assistant says cost per conversion was $137.27, that's the figure on the dashboard your client opens. Not a number the model added up on the fly, which would come out slightly different the next time you asked.
One source of truth. Your dashboards, your scheduled reports, and now your AI all read from the same data and the same metric definitions. Nothing to reconcile when a client quotes a figure back at you.
Zero integration work. No API keys, no OAuth app, no developer token, no script to babysit.
Every channel in one conversation. Google Ads next to GA4 next to Meta next to your SEO tools and your CRM, blended consistently. "Why did leads drop" can be answered across channels instead of one platform at a time.
Your history, preserved. Including metrics the platforms themselves no longer retain or expose consistently.
Built for many clients, not one. Many accounts, many sources, recurring work, client-facing output. The grouping and the isolation are already there.
Connect it in about a minute
- In Claude, open Settings → Connectors and add DashThis (or click here). In ChatGPT, it's your connector settings (or click here).
- Sign in with your DashThis account and approve. Access is read-only.
- Start a fresh conversation so the tool loads.
- Test it: "What dashboards do I have?"
Full walkthroughs: what an MCP connector is
One rule before the examples
Almost every mediocre answer comes from the same two missing pieces: which dashboard and which period.
Your assistant doesn't know that "the Vertex account" is the dashboard called "Vertex Industries - Paid Search." It doesn't know that when you say "last month" you mean the client's reporting month and not the last 30 days. Name both, and the quality of what comes back changes immediately.
Good: "On the Vertex Industries Paid Search dashboard, compare August to July and tell me what moved."
Less good: "How's paid search doing?"
Everything below assumes you've named the dashboard.
Example 1: The Monday morning sweep
The situation. You have eleven clients. You have one hour before your first call. You need to know which two or three deserve your attention today.
The prompt: Go through my dashboards for last month. For each client, give me one line: the single best thing I could tell them right now. Then tell me which two deserve a proactive call this week.
Three dashboards from the test account we ran this on, August 2026 against the previous period:
"All three are moving the right way, but for different reasons, so the three conversations should be different. The Shopify store is the real story: sales up 43% on the month, and net sales up 43.7%, which means the growth is holding after discounts and refunds rather than being bought with promotions. Lead with that. Google Ads is quietly getting more efficient: cost per conversion down 6%, cost per click down 40%, same conversion volume on slightly less spend. That's a good-news email, not a call. Meta is the one I'd pick up the phone for: 24% more link clicks on 3% less spend, so the targeting is working, but conversion value is still reading zero. That usually means value isn't being passed back rather than that the campaigns earned nothing. Worth confirming before the client asks."
Two things make that answer worth the sixty seconds. It ranked what matters instead of listing everything. And it treated the zero as something to check rather than reporting it as a result, which is the difference between a useful assistant and a dangerous one.
Follow up with: Draft the good-news email for the Shopify client, and give me talking points for the Meta call.
Why this works. One connection, every client, in a single pass. Your assistant doesn't log into three platforms or reconcile three definitions of "sales." It reads the same three dashboards your clients read.
Example 2: The monthly client email
The situation. It's the 3rd. The report already went out automatically. Now you owe eleven clients an email that explains it.
The prompt: Read the Google Ads dashboard for August and compare it to the previous period. Draft a client email: warm but direct, five short paragraphs, no jargon, lead with what matters most to them.
What came back. Here are the actual figures the connector returned from a demo Google Ads dashboard for August 2026, against the previous period:
And the draft opening it produced:
"Quick August recap. We spent slightly less than last month and brought in the same number of conversions, which means every conversion cost you about $9 less. The bigger shift is underneath that: clicks are far cheaper than they were, and more people are clicking the ads when they see them. One thing I want to flag before it becomes a trend, though. We're now showing up for about 16% of the searches we could be showing up for, down from about 25%. Cheaper traffic is good. Showing up a third less often than we were is the tradeoff, and it's worth a conversation about budget."
Why this works. Every number in that paragraph is the number on the client's report. And the assistant caught the thing a metric-by-metric summary would have buried: efficiency improved, reach shrank. That's the conversation, not the CPA.
Example 3: "Why did leads drop?"
The situation. The client emails at 4pm. Three words, no punctuation, mild panic.
The prompt: Leads are down on the GA4 dashboard year over year. Walk me through what changed, one metric at a time, and tell me which explanation the data actually supports.
What came back. From a real GA4 dashboard, August 2026 versus August 2025:
- Sessions: 104,301 vs 130,999 (-20.4%)
- New users: 45,420 vs 45,547 (basically flat)
- Views: 235,178 vs 309,698 (-24.1%)
- Bounce rate: 47.9% vs 43.3% (+4.5 pts)
- Conversions: 370 vs 1,190 (-68.9%)
The reading it offered:
"Conversions fell far faster than traffic did, so this isn't primarily a traffic story. Sessions are down 20% while new users held flat, which points to fewer return visits rather than fewer new people finding you. Bounce rate rose alongside it. The 69% conversion drop is out of proportion to all of that, so the first thing worth checking is whether conversion tracking changed or an event was redefined between these two periods. Before telling the client demand fell, rule that out."
Why that last line matters. A cause is always an inference. An assistant reading your dashboard can tell you what moved and what the movement is consistent with. It shouldn't tell you it knows why, and you shouldn't send a client an explanation it invented. Ask it to separate what the data shows from what it's guessing.
Follow up with: Give me two versions of the reply: one if tracking did break, one if it didn't.
Example 4: Twenty minutes before the client call
The situation. Call at 2. It's 1:38. You have not opened the dashboard.
The prompt: Five bullets for my 2pm on the Google Ads account. One win, one concern, one number they'll ask about, one thing I need a decision on, one thing to tee up for next month. Under 15 words each.
What came back:
- CPC dropped 40%, from $11.55 to $6.89. We're buying the same traffic for much less.
- Impression share fell to 16% from 25%. We're missing three-quarters of eligible searches.
- Cost per conversion: $137, down from $147.
- Decision needed: raise budget to recover impression share, or hold and bank the efficiency?
- Next month: conversion value is only $54 against $14K spend. Is value tracking set up correctly?
Why this works. It read one dashboard and gave you a meeting. The last bullet is the kind of thing that's obvious in the data and invisible when you're skimming a PDF at 1:38.
Example 5: The number the client is going to challenge
The situation. Same metric, different period definitions, and your client's internal dashboard says something else.
The prompt: Show me search impression share on the Google Ads dashboard three ways: the dashboard's own reporting month, the last 30 days, and the last 30 days versus the same window last year.
What came back. The connector returns each window separately and tells you which one answered:
- Dashboard's own period (Aug 1 to Aug 31, 2026): 15.92%
- Last 30 days (Aug 15 to Sep 13, 2026): 17.97%
- Same window in 2025: 9.99%
Why this matters. Three defensible numbers, three different stories. Down from last month, up over the trailing month, nearly double where it was a year ago. When a client pushes back on a figure, this is how you find out in ninety seconds whether you're looking at the same window they are.
By default the connector reads the dashboard's own period, which is what makes the answer match what your client sees. Ask for a different window and it tells you plainly which one it used.
Example 6: Explaining it to someone who's never opened a dashboard
The situation. Your contact is forwarding your report to their CFO.
The prompt: Rewrite the August summary for a CFO who has never opened a marketing dashboard. No acronyms. Two paragraphs. Tie everything back to cost and return.
What came back:
"In August we spent $14,276 on Google advertising and generated 104 new enquiries, at an average cost of $137 each. That's about $9 cheaper per enquiry than the month before, on slightly less spend. The cost of getting someone to click one of our ads dropped by roughly 40%, which is why the same money went further.
One caveat worth your attention. Our ads currently appear on about 16% of the relevant searches people make, down from 25%. We're being efficient with a smaller share of the available market. Increasing the budget would let us recover that share, but at a higher cost per click than we're enjoying right now. That's a growth-versus-efficiency decision, and it's yours to make."
Why this works. Same dashboard, same numbers, different reader. Translation for the audience is exactly the kind of thing an LLM does better than any reporting tool ever will. Your job was deciding what counts. It just changed the register.
Example 7: The pre-send check
The situation. Reports go out tomorrow at 6am. You'd like them not to be wrong.
The prompt: Which of my dashboards have a data source in error right now? Group them by which connection is broken, and tell me which ones have a report scheduled this week.
What comes back. The connector can filter for source health directly, so the assistant doesn't have to check a hundred dashboards one by one. In our test, it came back with the two expired connections behind nearly all of the breakage, and a note that dashboards with a broken source will still display, they just won't be refreshed.
Also worth asking: For the dashboards going out this week, is there any widget you couldn't read? I want to know what I'm flying blind on.
The connector is honest about this. A widget it can't read comes back marked as unavailable with a reason, rather than silently as a zero. Widgets that failed on our test dashboards were reported as failed, with an explicit note that they may still render fine in DashThis. That distinction saves you from telling a client that traffic was zero when really the fetch timed out.
Example 8: Chaining it with everything else your AI can reach
This is the one that actually changes your week, and it's the hardest to demo in a screenshot.
Your assistant already has your inbox, your calendar, your meeting notes, and often your CRM. It has never had your clients' numbers. Once it does, prompts stop being about reporting and start being about your workflow:
Check my calendar for client calls tomorrow. For each one, find the matching DashThis dashboard, pull last month's numbers, and put three talking points in a note.
Read the last email thread with this client. They asked about cost per lead. Pull the actual figure from their dashboard and draft a reply that answers them directly.
Go through every dashboard in the "Retail" group, flag anything unusual, and give me one line per client.
Cross-reference: which accounts are marked at-risk in our CRM and also had a down month on their dashboard?
Take last quarter's three monthly dashboards and outline the QBR deck. One slide per theme, and note which dashboard each claim comes from.
What it can't do, plainly
Honesty here is worth more than a feature list, because knowing the edges makes your prompts better.
It can't change anything. No creating dashboards, no editing widgets, no sending or scheduling reports. Read-only, by design. Your AI cannot break a client's report.
It doesn't know the word "client." DashThis has dashboards and dashboard groups. Your assistant infers the client from the group and the title. If your naming is a mess, its grouping will be too. This is the single highest-return cleanup you can do before connecting.
Some widgets don't read. A widget whose content can't be fetched comes back marked unsupported or failed, not empty.
Big tables get truncated. Wide breakdowns like "sessions by landing page" come back with the top rows and a flag saying there were more. Ask for a filtered or narrower view instead of the whole table.
It reads, it doesn't deliver. The chat answer disappears when you close the tab. Your client still gets their branded report on the 3rd, because that part keeps running on its own, whether or not you ever open an AI tool.
It reads what you can read. Only the accounts you have access to, each client isolated, data sent only when you ask a question. Revocable in one click.
The prompt library
Copy, paste, replace the bracketed bits.
Getting oriented
- What dashboards do I have? Group them by client.
- Which dashboards use [Google Ads / GA4 / Meta Ads]?
- Show me every dashboard with "[client name]" in the title.
- What's on the [dashboard name] dashboard? Walk me through how it's built before you pull any numbers.
- Which integrations feed the [dashboard name] dashboard?
- What reporting period and frequency is [dashboard name] set to?
- How many dashboards are in this account, and when was each one created?
Health and hygiene
- Which dashboards have a data source in error right now?
- Group the broken dashboards by which connection expired.
- Are all the sources healthy on [client name]'s dashboards?
- Which dashboards haven't been touched since [year]?
- Find dashboards with near-duplicate titles. I think we have copies.
- Which of my [integration] connections are failing, and how many dashboards does each one affect?
Reading a single dashboard
- Pull [dashboard name] for last month and compare to the previous period.
- Same dashboard, compare to the same month last year instead.
- Give me just the KPI tiles from [dashboard name]. Skip the tables.
- What's the single biggest change on [dashboard name] this period?
- Show me only the widgets with "conversion" in the title.
- Which metric on this dashboard moved the most in percentage terms? Which moved the most in absolute terms?
- Is there anything on this dashboard you couldn't read?
- Read [dashboard name] for [last7Days / last30Days / thisMonth / lastMonth / thisYear / lastYear] instead of its own period.
Explaining what moved
- Explain the change in [metric] on [dashboard name] in plain language.
- Separate what the data shows from what you're inferring. Label each.
- Give me three possible explanations for this drop, ranked by how well the data supports them.
- Is this drop bigger than normal month-to-month variation on this account?
- Which channel is responsible for most of the change?
- Did [metric] fall because of volume or because of rate?
- What would I need to check in the platform to confirm your theory?
Writing to the client
- Draft the monthly email from [dashboard name]. Warm, direct, five paragraphs, no jargon.
- Same email, but the client is unhappy and I need to acknowledge that before the numbers.
- Rewrite this for someone who has never opened a marketing dashboard.
- Rewrite it for a CFO. Tie everything to cost and return.
- Turn this into a Slack message, three lines max.
- Write the one-sentence summary that goes at the top of the report.
- Draft the text for the commentary widget on this dashboard, in my voice.
- Write the version I send when the news is bad and I want to keep the account.
- Give me the same update in French.
Meeting prep
- Five bullets before my call on [client name]. One win, one concern, one number they'll ask about, one decision I need, one thing to tee up.
- What's the hardest question this client could ask me about these numbers, and how do I answer it?
- Build me a two-minute verbal summary. Write it the way I'd say it out loud.
- What did we promise last quarter, and did we deliver it? Check the commentary on the older dashboards.
- Give me one number to open the call with.
Across all your clients
- Which clients need attention this week, and why? One line each.
- Go through every dashboard in the [group name] group and flag anything unusual.
- Which accounts increased spend but not conversions this month?
- Is there a trend showing up across multiple clients this month?
- Which clients had their best month of the year?
- Which clients would I be embarrassed to present to tomorrow?
Quarterly and annual
- Pull the last three months of [dashboard name] and outline the quarterly story.
- Outline the QBR deck. One slide per theme, and note which dashboard each claim comes from.
- Compare this quarter to the same quarter last year and tell me the trajectory.
- Build the year-in-review narrative from these dashboards.
Chained with your other tools
- Check my calendar for client calls tomorrow, find each matching dashboard, and prep talking points.
- Read the last thread with this client, pull the number they asked about, and draft the reply.
- Which at-risk accounts in the CRM also had a down month?
- Save this month's summaries as one doc, one section per client.
- Every Monday, sweep my dashboards and send me the three clients who need attention.
Three habits that make every answer better
Name the dashboard and the period. Said already, worth saying twice. It's the difference between an answer and a guess.
Ask it to show its work. "Which widget did that number come from?" takes four seconds and catches the rare case where your assistant grabbed the wrong tile.
Ask it to separate fact from inference. Your dashboard knows what happened. Nothing knows why. An assistant that labels its guesses as guesses is one you can safely paste into a client email. One that doesn't, isn't.